Create a report in excel 2007 with Open Xml SDK 10

I need a program that send by email some reports each day to a certain number of recipients. The first thing I need to solve is the format of the report, a pdf could be a good thing, but I need to find a library to generate pdf etc etc. The best solution is to use Excel 2007 and send the whole excel file by email. The good thing about excel is that he already possess an incredible number of graph style, and thanks to the open Xml format creating a report is a breeze.

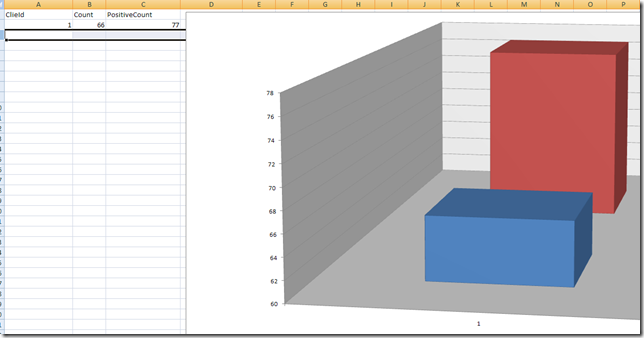
The first step is create a master document, the master document will contain a single row of data, and you can create the graphics the way you like.

image

Now we only need to modify the file adding real data and updating graphics range to accommodate the new data. My first tentative is to build an ExcelFiller class that can do this for me with simple syntax. You can find the whole file here, you can use as starting point if you need.

1
2
3
4
5
6
7
8
public ExcelFiller(String originalDocumentPath, String destinationDocumentPath)
{
    //Make a copy of the template file
    File.Copy(originalDocumentPath, destinationDocumentPath, true);

    //Open up the copied template workbook
    myWorkbook = SpreadsheetDocument.Open(destinationDocumentPath, true);
}

As usual in the constructor you need to copy the original file in another position to be able to modify the document. Then you can call the method FillSheet that return a ExcelFillerSheet, a simple class that is used to phisically do the substitution. In the constructor of ExcelFillerSheet I simply create some Linq 2 XML structure of the basic part of the documetn

1
2
3
4
5
6
7
WorkbookPart workbookPart = document.WorkbookPart;
using (XmlReader xmlr = XmlReader.Create(workbookPart.GetStream()))
    XmlWorkBook = XElement.Load(xmlr);

WorksheetPart = GetWorksheetByName(sheetName);
using (XmlReader xmlr = XmlReader.Create(this.WorksheetPart.GetStream()))
    XmlData = XElement.Load(xmlr);

Thanks to the GetStream() methods of the SDK objects I can read the whole xml content in one step, so I first get the WorkBookPart of the whole excel file. In this file there are all the informations on contained sheets, and more. Then I call GetWorksheetByName function to grab the XML content of a worksheet given its name.

 1
 2
 3
 4
 5
 6
 7
 8
 9
10
11
private WorksheetPart GetWorksheetByName(String name)
{
    XElement relNode = (from XElement e in XmlWorkBook.Descendants(ExcelFiller.ns_s + "sheet")
                              where e.Attribute("name").Value == name
                              select e).Single();

    WorkbookPart workbookPart = document.WorkbookPart;
    WorksheetPart retvalue = (WorksheetPart)workbookPart.GetPartById(
        relNode.Attribute(ExcelFiller.ns_r + "id").Value);
    return retvalue;
}

Thanks to Linq 2 XML finding the id of the worksheet is really simple, I look for all descendants nodes named <sheet> (do not forget the namespace), then I filter the only one with the name attribute equal to desidered name and take the Single node. When you have the id of the sheet you can simply use GetPartById to grab a reference to the desidered sheet.

To make the code simple I store all new values in a List<List<Object>> structure, this is not the best option, but it works :D. When you finished to insert data you can call the SaveData routine.

 1
 2
 3
 4
 5
 6
 7
 8
 9
10
11
12
13
14
15
16
17
18
19
20
21
22
23
24
25
26
27
28
29
30
31
32
33
34
35
36
 1 public ExcelFiller SaveData(Int32 numOfRowsToSkip)
 2 {
 3 XElement sheetData = XmlData.Descendants(ExcelFiller.ns_s + "sheetData").Single();
 4 //now we have a series of row, first of all build the new data
 5 List<XElement> elements = new List<XElement>();
 6 elements.AddRange(sheetData.Elements().Take(numOfRowsToSkip));
 7 Int32 currentRowNum = numOfRowsToSkip + 1;
 8 Char currentColumn;
 9 foreach (List<Object> lo in values)
10 {
11     //this is a line
12     currentColumn = 'A';
13     XElement row = new XElement(ExcelFiller.ns_s + "row",
14      new XAttribute(ExcelFiller.ns_s + "r", currentRowNum),
15      new XAttribute(ExcelFiller.ns_s + "spans", "1:" + lo.Count));
16     foreach (var obj in lo)
17     {
18         row.Add(new XElement(ExcelFiller.ns_s + "c",
19                                     new XAttribute(ExcelFiller.ns_s + "r", currentColumn + currentRowNum),
20                                     new XElement(ExcelFiller.ns_s + "v", new XText(obj.ToString()))));
21         currentColumn++;
22     }
23     elements.Add(row);
24 }
25 //Now we have all elements
26 sheetData.Elements().Remove();
27 sheetData.Add(elements);
28 using (Stream s = GetWorksheetByName(SheetName).GetStream(FileMode.Create, FileAccess.Write))
29 {
30     using (XmlWriter xmlw = XmlWriter.Create(s))
31     {
32         XmlData.WriteTo(xmlw);
33     }
34 }
35 return Filler;
36 }

Modifying the document is a two phase process. In the first part I create a new list of XElement that will be filled with all the rows of the sheet. In line 6 I copy into this array the first X lines of the graph (since I need to open a graph and add data to some other existing data). The next step is creating an XElement for each row you want to insert. In line 3 I used LINQ 2 XML to grab a reference to the <sheetData> node, in line 26 I remove all actual elements (all the rows) and reinsert the new list of row. The final step is grabbing again the stream associated with the worksheet, and this time write down the new content.

The operation is still not completed, if you open the document you can see that new data are there, but the graph still shows old numbers. This happens because the graph stores a reference of the original range of values, you need to update it.

 1
 2
 3
 4
 5
 6
 7
 8
 9
10
11
12
13
14
15
16
17
18
19
20
21
22
23
24
25
26
27
28
29
30
31
32
33
34
35
36
37
38
39
 1 public ExcelFillerSheet AdjustGraphData(Int32 numRows)
 2 {
 3     ChartPart part = WorksheetPart.DrawingsPart.ChartParts.First();
 4     XElement XmlChart;
 5     using (XmlReader xmlr = XmlReader.Create(part.GetStream()))
 6         XmlChart = XElement.Load(xmlr);
 7     //now we can manipulate the charts value, find the category
 8     var  catrange = from cat in XmlChart.Descendants(ExcelFiller.ns_c + "cat")
 9                          from f in cat.Descendants(ExcelFiller.ns_c + "f")
10                          select f;
11     //ora ho i nodi
12     foreach (var element in catrange )
13     {
14         String basevalue = element.Value.Split('$')[0];
15         element.Value = basevalue + "$A$2:$A$" + (numRows + 1);
16     }
17 
18     var valrange = from cat in XmlChart.Descendants(ExcelFiller.ns_c + "val")
19                         from f in cat.Descendants(ExcelFiller.ns_c + "f")
20                         select f;
21     //ora ho i nodi
22     Char startChar = 'B';
23     foreach (var element in valrange)
24     {
25         String basevalue = element.Value.Split('$')[0];
26         element.Value = basevalue + "$" + startChar + "$2:$" + startChar + "$" + (numRows + 1);
27         startChar++;
28     }
29 
30     using (Stream s = part.GetStream(FileMode.Create, FileAccess.Write))
31     {
32         using (XmlWriter xmlw = XmlWriter.Create(s))
33         {
34             XmlChart.WriteTo(xmlw);
35         }
36     }
37 
38     return this;
39 }

Now it is finally done. In line 3 I grab the first ChartParts of the worksheet, this because I know that the graphs is the only one included in the worksheet. In the first part I cycle through the elements of type <cat> where categories are stored. The value numRows is passed by the caller, and it is the number of rows you want to include in the graph. in line 15 you can see that I simply change the range of the graph to accommodate new data. Since my graph have two distinct sets of values, in line 18 I select all nodes <val>, then I change the range in line 26, starting from column B. Here it is a simple test.

 1
 2
 3
 4
 5
 6
 7
 8
 9
10
11
12
ExcelFiller ef = new ExcelFiller(@"samples\test.xlsx", @"samples\testc.xlsx");
ef.FillASheet("RilevazioniPerCliente7GG")
   .AddData(1).AddData(5).AddData(44)
   .CloseRow().AddData(2).AddData(100).AddData(5)
   .CloseRow().AddData(3).AddData(200).AddData(10)
   .CloseRow().AddData(4).AddData(300).AddData(15)
   .CloseRow().AddData(5).AddData(400).AddData(10)
   .CloseRow().AddData(6).AddData(50).AddData(50)
   .CloseRow().AddData(7).AddData(60).AddData(22)
   .AdjustGraphData(7)
   .SaveData(1);
ef.Dispose();

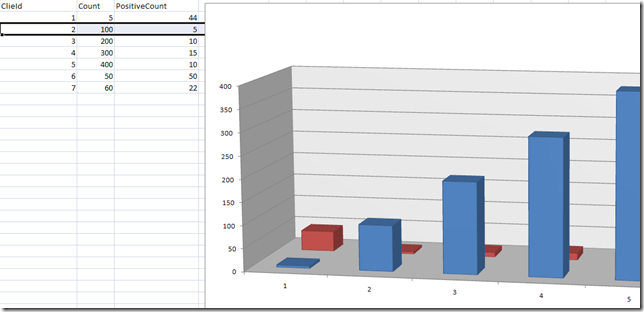
If you run it with the original document the result is this.

image

As you can check all values are inserted correctly, and the graph is updated with the new data.

Some people asked me why I do not use the 2.0 SDK that has some strongly typed classes to manipulate data the answer is. I need to put this code in production and cannot use a CTP library. Moreover using the old 1.0 SDK you have full control over XML data, and there is no limit to the complexity of the documents you can create.

alk.

Tags: OpenXml Excel Graphics Report