Debugging Production Issues with Dump Files and Visual Studio
Sometimes, you may encounter a problem in a production environment, such as a service that suddenly starts consuming a significant amount of RAM and CPU. In the past, I’ve seen people attempt to install Visual Studio on a production server to debug the issue directly, instead of relying on logs or other techniques. However, there’s a better approach: creating a dump file of the problematic process from the Task Manager. You can just right-click the process on Task Manager and request a MiniDump.
A dump file allows you to perform various analyses, such as examining memory content, threads, and more, using the WinDbg software. However, it’s often more convenient to open the dump file in Visual Studio, as it enables you to debug the software as if you were actually attached to the process on a live server.
The primary concern when working with dump files is ensuring that you have the correct symbols. To address this, you can use a symbol server to store your symbols securely. If you’re using Azure DevOps, I’ve written several blog posts on how to use a symbol server in Azure DevOps with an Azure DevOps pipeline. This setup can be invaluable for diagnosing problems using dump files.
- Simplifying Library Debugging with Azure DevOps Symbol Server
- Symbol server made easy with Azure DevOps
When you obtain a dump file from a live system, you also need to collect the following DLLs from the C:\Windows\Microsoft.NET\Framework64\v4.0.30319 directory:
- clr.dll
- mscordacwks.dll
- SOS.dll
These DLLs represent the CLR and the Son of Strike (SOS) extension, which is useful for WinDbg, Visual Studio, and other debuggers when analyzing dump files. It’s a good practice to have multiple versions of these DLLs from various production systems on your development machine. To do this, right-click on one of the three files, note the version number, and place them in an appropriately named directory on your computer.
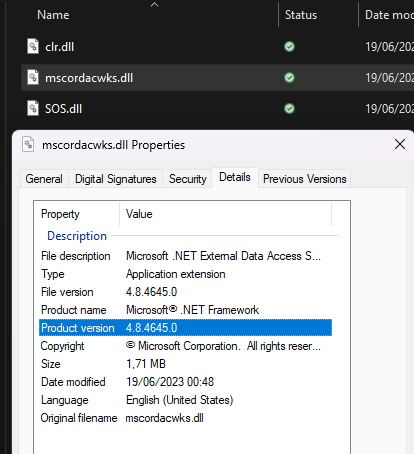
Figure 1. Viewing actual version of the framework used in production machine
Once you have these DLLs on your machine, you can configure Visual Studio’s symbol locations to look in both the standard location and the directory where you’ve placed the DLLs. Additionally, you can add the NuGet.org symbol server and your Azure DevOps account containing your source code.
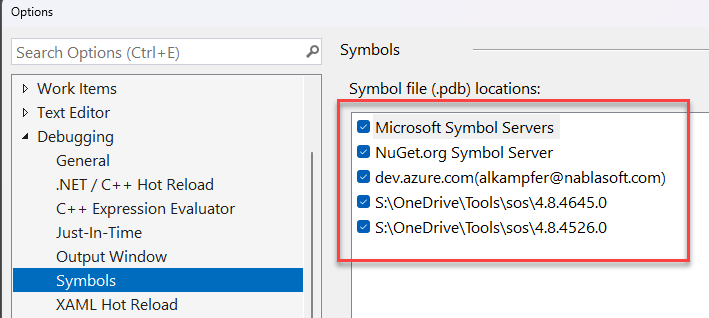
Figure 2. Add all versions of the framework/SOS in your debugging symbols settings
With everything set up, and your source code is in your dev.azure.com account you are ready to go. The only prerequisite is that you created the dll that you deployed from an azure devops pipeline that has the task to index symbols on the server. This will allow Visual Studio to locate the pdb files and then download the source code used to build that code. You can also read my blog post Simplifying Library Debugging with Azure DevOps Symbol Server to be able to debug also packages referenced by the code you are debugging.
Then, simply open Visual Studio and then open the dump file.
Upon opening the dump file, Visual Studio will display general information about it. You’ll also see the debug option in the right part of the Visual Studio window. Press the debug button to start debugging the dump file, either in managed-only or mixed mode, depending on whether you want to debug only the .NET part of the code or even the native part.
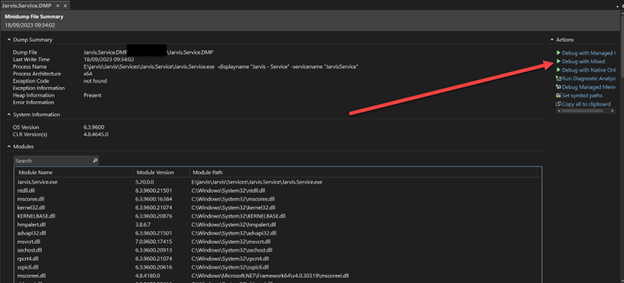
Figure 3. Dump file opened in Visual Studio
If all your libraries are published with a symbol server and your main code is indexed in your symbol server (usually Azure DevOps), Visual Studio can download the exact version of the code used to generate that specific version of the DLL.
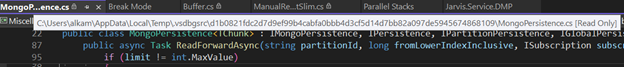
Figure 4. Visual Studio uses Azure DevOps symbol server to download source files
This allows you to walk down the stack, inspect function parameters, and easily debug a minidump file from a production server.
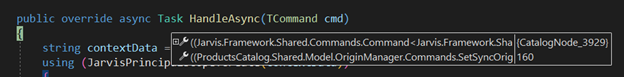
Figure 5. Visual Studio shows parameter values as in standard debugging session
In conclusion, I strongly recommend ensuring that you index your symbols when compiling your software before deploying it to production. This practice will significantly improve your debugging experience and make it more powerful.
Having a minidump allows also to use WinDbg to examine the dump file, it is less “visual” but more powerful for some specific tasks. You can ask for memory usage summary for each .NET type, then you can look at each instance, verify which object are keeping the object from being collected and so on.
If you mix this with the ability to use a software like procdump to automate the creation of dump files, you can have a powerful tool to debug production issues. Remember that Procdump can be configure to automatically monitor a process and create a dump when certain condition are met, like RAM usage or CPU usage.
procdump jarvis.configurationservice.host.exe -ma -mp -m 1024And the sofware will start monitoring the process.
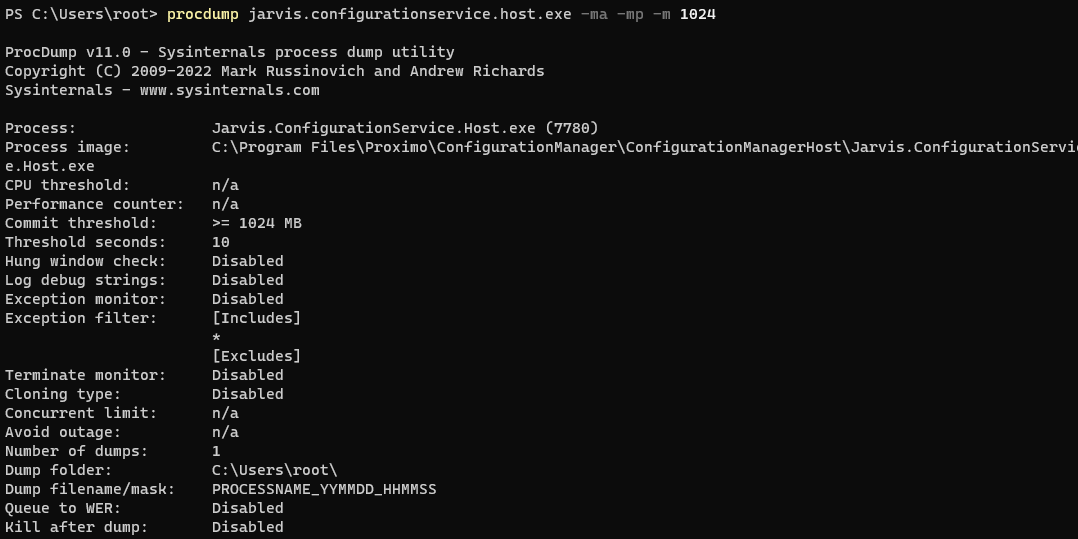
Figure 6. procdump monitor in action
Gian Maria.